 SwissMisfortune
Understanding fund fact-sheets
Fact-sheets describe the characteristics of a fund, and understanding them is crucial to knowing what you're investing your money into.

Whether you consult with a financial advisor or decide to go it alone, at some point you will need to choose which fund to invest in (or the advisor will tell you). Recent estimates suggest that there are now more ETFs than actual stocks in the market; therefore, to choose among them, you need a decent understanding of what they are about and whether they fit your needs. Fact-sheets are your introduction to a fund and what characterizes it. Whether you find them yourself or your advisor gives them to you, understanding them is crucial to knowing what you're investing your money into.
For this explanation, we will look at the UBS Core MSCI World UCITS ETF USD fact-sheet, and yes, that's a mouthful.
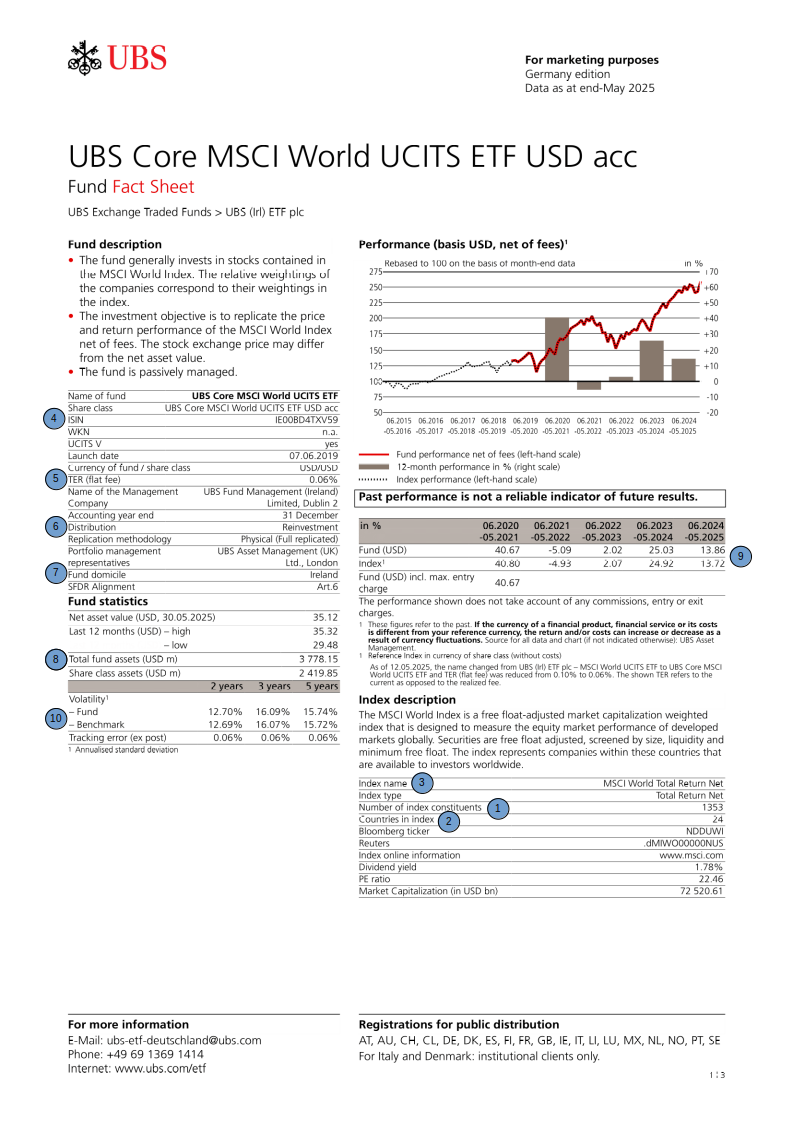
Example of ETF fact-sheet.
- Number of constituents indicates the number of securities (stocks, bonds) the fund currently invests in. This varies a lot depending on the fund's type and objective. A globally diversified ETF like this one invests in thousands of different stocks all over the world. A more targeted fund, for instance one focusing on the top 20 Swiss companies, would invest in well, just 20 securities.
- Countries in index states the number of countries that are represented in the fund. For an index called "World" it might appear odd that the number is only 23, and the reason is that this index targets the developed world. MSCI also offers a world index that includes emerging markets, the MSCI ACWI (all country world index). In short, don't give too much weight to the names. Different agencies have different standards and nomenclature (world, global, international, etc). For example, South Korea is not considered developed by MSCI whereas it is by FTSE (another index provider).
- Index name (sometimes benchmark) is the index that this fund is replicating (if it's a passive index). Alternatively, for an active fund, the index is usually what the fund is trying to outperform. Index providers such as MSCI determine how much of each stock should be purchased for a specific strategy, and fund managers (in this case UBS) follow the index's recipe and implement it accordingly. Knowing the index is useful for three reasons. First, if you invest in this ETF and someday it closes, there might be another fund manager (Vanguard, Blackrock, Xtrackers, etc) that also offers an ETF that tracks the same index, allowing you to stay invested in the same underlying product over time. Secondly, you might save some money. When multiple companies offer funds that track the same index, some are often cheaper than others. Lastly, as is the case here, this UBS-provided fund was launched in 2019, meaning you only have a handful of years of historical performance to evaluate it. The underlying MSCI World index, however, was created in 1986, meaning that with a quick search you are able to find how it performed in the last 40 years, giving you a much wider perspective.
- ISIN is a unique identifier for the fund, although searching by name should also be fruitful; not all brokerage applications follow the same naming conventions. Searching the ISIN ensures you find exactly what you're looking for.
- TER, which stands for Total Expense Ratio, is the primary cost of the fund, and in this case, it's only 0.06%. What that means is that if you invest $100 in this fund, once per year, you will have to pay $0.06 as a fee. Generally speaking, cheap passive ETFs are typically below 0.3% TER (the good ones anyway). Active funds, on the other hand, can easily be above 1-2% in fees. Considering that the historical average return of the market for the developed world is around 5-7%, why give 2% to the fund manager when you can pocket it yourself? In short, fees matter a lot.
Note that some funds might have additional costs, like exit costs or costs associated with the performance of the fund. This is less common nowadays, but the fact sheet would tell you just the same. - Distribution describes what the fund does with dividends and other sources of income from the stocks or bonds it holds. Funds can either be distributive or accumulative (also called reinvestment). As the name suggests, distributive funds pay you this income in the form of dividends, whereas an accumulative fund would automatically reinvest it. Depending on the fund location (and your own), different taxes might be applied to the income you receive. Likewise, if you intend to reinvest this income in the same fund, it usually involves an additional transaction and therefore an additional cost. Fund managers can do this more efficiently than you can through your broker, so depending on your intentions, choosing an accumulative fund rather than a distributive one might be more sensible. Sometimes, the same fund exists in both versions, so look around.
- Fund domicile matters primarily for taxation purposes. Different countries have different agreements, and depending on the fund's location and your own, different taxation rules apply. Likewise, depending on these agreements, some withholding taxes can be reclaimed. It's a complicated topic, and it warrants a deep dive of its own.
- Total fund assets indicates the size of the fund, meaning how much money is currently invested in it. If you recall, the TER is a percentage value, which means that the fund size effectively determines how profitable the fund is for the fund manager. Smaller funds are more at risk of being discontinued, which would force you to sell and find an alternative, and depending on where you live, this could trigger capital gains tax. As a Swiss private investor capital gains are tax-exempt so it doesn't matter, but regardless, having to find an alternative is often a hassle; therefore, all else being equal, larger funds are preferable.
- Performance gives you a snapshot of the recent yearly returns of the fund, often in conjunction with the returns of the underlying index. Comparing the two allows you to see how well (and more importantly how poorly) the fund tracks the index. Indexes are theoretical and don't take into account transaction costs related to the implementation; therefore, small deviations are to be expected. However, if the separation between the two is big (often referred as tracking error), it means that the fund manager isn't capturing all the returns that it could and, therefore, it might be warranted to look elsewhere. Fact-sheets usually only give you the performance over the last few years, and as the disclaimer hints at, past performance is not a reliable indicator of future results.
- Volatility gives you an indication of the short-term oscillation you should expect from this investment. A higher volatility indicates that the value can potentially vary over a larger range, implying greater price fluctuations.
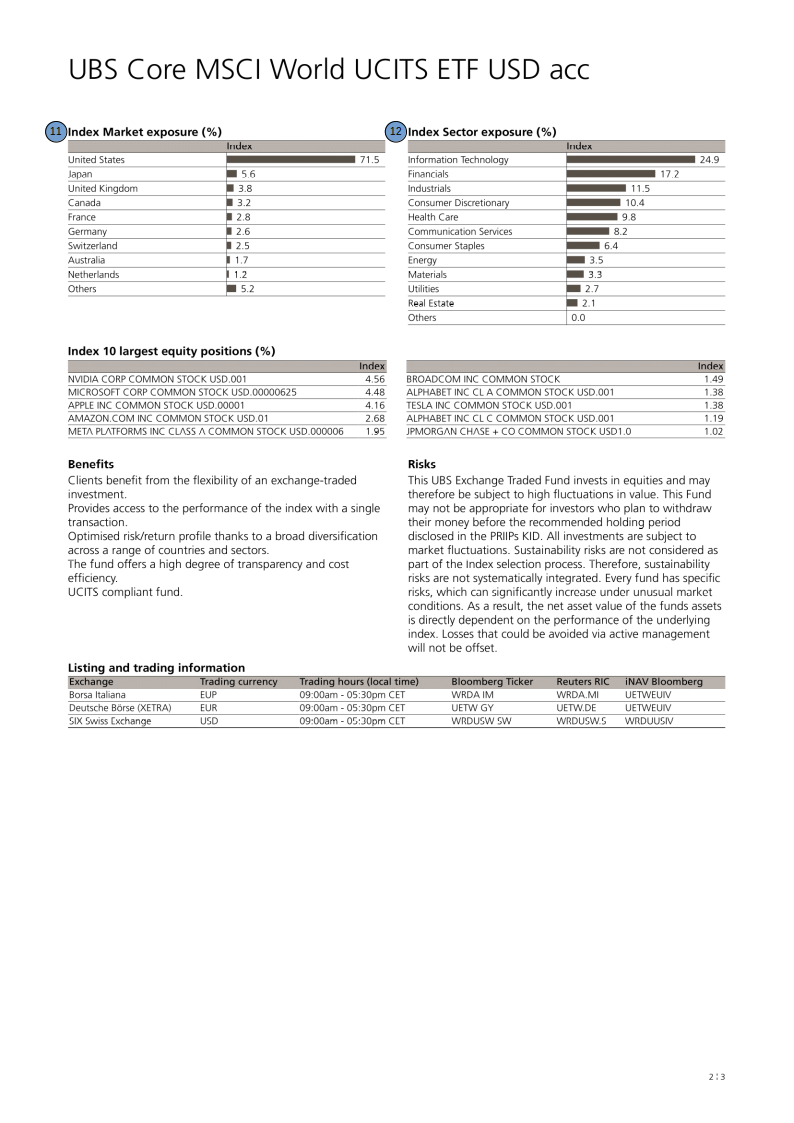
- Market exposure indicates how the fund constituents are distributed geographically. By market capitalization, the US market accounts for 60-70% of the global market, and consequently, the MSCI World assigns a similar weight to the US in the index. This isn't always the case; some funds give each country the same weight, regardless of its actual size on the global scale. In short, this section allows you to see how geographically distributed the constituents are.
- Index sector indicates the distribution of the securities across sectors. Different sectors perform better or worse at various points in time. If the fund is too concentrated on a single sector, it could lead to prolonged periods of underperformance. In summary, this information allows you to gauge how diversified the assets are across sectors.
As you might have realized, much can be grasped from a simple 2-page fact-sheet. It doesn't paint the full picture, but it certainly provides you with useful information you can use to make your decisions.
Read next

Lump sum investing vs Dollar cost averaging
Lump-sum investing often outperforms dollar-cost averaging; however, DCA remains popular due to behavioral factors like loss aversion and regret.
Home-country bias
Overweighting your home country in investments may feel natural, but history shows diversification is key to managing risk and volatility.
DEGIRO review 2025
DEGIRO is a low-cost brokerage platform available to European and Swiss investors. The article takes a closer look at what it has to offer.